
Aug 13 2020 - YRC Worldwide Inc.: Shares Still Heavily Discounted - Part1A
Summary
Centaur Investments is pleased to share this latest long thesis update and a revised price target of on shares of YRC Worldwide, Inc.
YRCW's shares remain heavily discounted as investors fixate on everything negative while overlooking 10 years of operational improvement, HNRY Logistics' growth potential, and fair market value of property and equipment.
Management's multi-year strategy and 0 million in new fleet equipment purchases should lower operating expenses, increase cash flows, and support continuous reinvestment and debt repayment from FY 2022 onward.
The U.S. Government's 29.6% stake in the business should provide a boost to employee morale across the company, and tacitly incentivize management to concentrate on delivering shareholder returns.
Lastly, barring Congressional Oversight Committee interference, the low interest 0 million CARES Act loan and term loan covenant amendment clear the runway to achieve sustained profitability.
Introduction
Over the last year, many people have frequently reached out via email, social media, and direct messages expressing interest in our opinion about this company. At no point were our direct messages and Twitter mentions any busier than these last six months as rumors of the company’s supposedly imminent demise became normal conversation across the transportation industry.
So, finally, following another intense reevaluation of the business, Centaur Investments is pleased to share this latest long thesis update on YRC Worldwide, Inc. (YRCW). The near-term price target for the shares has been revised down to from the PT previously suggested in this article.
While the Congressional Oversight Committee’s ongoing inquiry into the Treasury Department’s justifications for approving YRCW's CARES Act loan may weigh on the company’s stock price in the near term, we are not toning down our previous 'Conviction Buy' opinion on the shares. In addition to the Oversight Committee’s public scrutiny, the company has experienced a series of negative attacks from the media which, in our opinion, are based on ancient history and outright unfounded reasoning.
Centaur’s analysis of the facts as presented in this article concludes that, contrary to popular belief, the business was on track to achieving sustainable profitability prior to this pandemic-induced economic crisis. Additionally, the company’s past financial challenges were primarily caused by a combination of historically high cost of debt and need for new fleet equipment due to underinvestment, not mismanagement or neglect, as many seem to believe. Lastly, the company’s poor stock price performance may be linked to widely held bearish views which themselves are affected by multiple cognitive biases.
More specifically, public anchoring to the company’s turbulent past appears to have a role in the market’s inability to acknowledge what has been clear financial progress over the last decade, despite seemingly endless obstacles. The company’s historical income statements as pictured below, perfectly capture sequential operating income improvement. However, that progress has long been overlooked by a market which favors myopic events like net income and earnings per share, often impacted by non-cash accounting math and cyclical factors.
YRCW's Striking Operating Income Growth

Source: YRC Worldwide's 10-K SEC filings, via Seeking Alpha
It should be noted that the table above intentionally excludes FY 2019, as several one-time nonrecurring charges weighed on operating income, and can mislead one into thinking that financial improvement has stalled. Browsing through headlines of recent press articles about the company which tend to center on YRCW's 4 million net loss from last year confirms this is exactly what is happening.
The volume of supporting evidence presented throughout this article should be convincing enough to warrant a positive opinion about the future trajectory of the company. In our view, when the pandemic finally subsides and economic stability returns, YRCW may very well become one of those ‘ten-bagger’ opportunities Peter Lynch lectured about in his books.
Some may not be aware of this fact, but prior to the pandemic, management already had a sound multi-point and multi-year strategy in place. Barring a double-dip period of economic contraction, or an unexpected stalling of the global economic recovery, the two CARES Act loans should adequately bridge the performance gap left by the pandemic, and may even act as a catalyst by accelerating the timeline to achieving sustainable profitability. Management’s strategy, which was refined in 2019, forms the basis of this long thesis and all our prior coverage of this company. In this update, the thesis has been revised to include the latest developments. For those new to Centaur’s research, the key arguments of the long thesis are reiterated below.
Centaur Investments’ Long Thesis on YRCW (Updated August 2020):
- Industry-wide pricing and capacity discipline will support management’s multi-point strategy while allowing the company to offset cost inflation through periodic contractual and general price increases.
- Property in suburban metro areas acquired over a century and recorded at cost on the balance sheet is a goldmine of hidden asset value which the market does not seem to realize.
- YRCW’s 3PL startup venture, HNRY Logistics, provides the company with a new revenue vertical and contribution margin through asset-light services, offering longer term sales growth potential.
- Revenue equipment replenishment will substantially reduce maintenance and fuel expenses, leading to immediate sequential decline in the company’s operating ratio.
- Revenue equipment replenishment eliminates need for expensive short-term rental equipment, emergency roadside repairs, and towing services which will deliver cumulative operating ratio improvement.
- Network optimization efforts will maximize load factor across the company’s network, leading to increased operational efficiency, density, yield, and incremental operating ratio improvement.
- Software migration to the cloud will deliver efficiency gains and support pricing through improved business visualization, leading to further operating ratio improvement.
- Labor management synergies gained in the 2019 collective bargaining agreement will partially offset wage inflation, healthcare, welfare, and overtime costs.
- Workforce consolidation, training, and organizational culture development will improve worker morale, productivity per labor hour, and further reduce overtime costs.
- Apollo term loan covenant amendment and 2020 CARES Act loan package allows management to focus on their multi-year strategy and clears the runway to sustainable profitability.
- The two low interest CARES Act loans totaling 0 million substantially reduce the company’s cost of capital while accelerating their fleet replenishment program and technology deployment.
- The 29.6% U.S. government stake tacitly pressures management to improve operational performance in a timely manner, likely accelerating the timeline to sustainable profitability.
- Proposed ‘Employee Stock Ownership Plan’ may create a share price floor, reduce share price volatility, and empower employee engagement.
- Potential interest and amortization savings from deleveraging and replacement of high-interest equipment leases with new lower-rate equipment leases and purchase options.
- Removal of going concern uncertainty will renew customer interest, deliver sales growth, and allow company to continue defending market share.
Reviewing recent press articles about the company, it's quite clear that many investors do not understand exactly why the company reported a 4 million net loss for 2019. All they seem to know, and all they seem to care about, is that the company recorded a net loss in the year preceding the pandemic. In the minds of these investors, the net loss means the company was on its way to bankruptcy, despite substantial contradicting evidence. So, let's review the company's challenging 2019 fiscal year to pinpoint exactly what contributed to last year's net loss and follow up with current macroeconomic and industry developments.
First and foremost, entering 2019 YRCW was still in early stages of programs like fleet and equipment replenishment, and cloud-based software deployment. The company has been slowly refreshing its fleet of 14,000 tractors and over 45,000 trailers since 2013. From 2015 onward, the company’s CapEx spending was gradually increased from less than 5% of total annual sales to a steady range of 5% to 7%. This sums up to about 0 million to 0 million per year, based on FY 2018 and FY 2019 total sales, including fuel surcharges. Fiscal year 2018 was a turning point for the company, as record demand for LTL shipping services allowed them to ramp up new equipment orders.
However, 2019 marked the beginning of a freight recession which coincided with the expiration of a major collective bargaining agreement. As management sat at the negotiation table with Teamsters’ leaders, competitors pounced on the opportunity to poach YRC’s customers by spreading rumors of an imminent labor strike which never actually happened. With historically thin operating margins, the downward revenue pressure during labor agreement negotiations meant that earnings would most likely turn negative for the year.
Yet throughout the freight recession, management continued to reinvest in the business, ordered and took delivery of thousands of new pieces of equipment, continued rolling out cloud-based transportation management software, consolidated thousands of corporate-level jobs, and ramped up services of their new asset-light unit, HNRY Logistics.
In May 2019, management finally locked in a new 5-year collective bargaining agreement, with each party walking away from the negotiating table with gains. The Teamsters regained a week of vacation, kept their existing healthcare coverage, and won an 18% wage increase spread over a 5-year period. Meanwhile, the company added abilities to hire part-time labor, non-CDL dock workers, non-CDL box truck drivers, and expanded purchased transportation capacity.
Next, they plowed through the front-loaded expenses of the new labor agreement in the second half of 2019, transferred New Penn’s corporate operations to their headquarters in Kansas, locked in a credit rating upgrade from Moody’s, refinanced a major term loan with a new lender on much favorable terms, consolidated their sales workforce, and implemented a giant enterprise resource planning software migration to the cloud. They did all of this in one year while battling competitors in a slowing economy.
Credit to YRCW’s former CFO, Stephanie Fisher, for spearheading those efforts. Stephanie climbed the ranks at YRCW from a senior accountant role to VP and controller under James Pierson, and then on to CFO. Although the combination of these events would weigh on the company’s earnings, management had to get those costs out of the way quickly to get the business back on track.
Exiting 2019, the downtrend in freight shipments was relentless across the industry, and the business outlook for 2020 remained highly uncertain. The broader economic cycle was running out of steam, and trouble was developing in credit markets. Shortly after the company refinanced their only term loan, the Federal Reserve intervened in the repo market for the first time in a decade.
The company had little margin room for mistakes in a serious downturn, and in December 2019, YRCW’s former CFO, James Pierson, was brought back in. A former managing director at Alvarez & Marsal and FTI Consulting, Pierson had extensive experience navigating turnaround situations in challenging economic environments. He also knew exactly how to balance YRCW’s books better than anyone else.
In addition to the CFO change, in what was a clear effort to curb shareholder dilution, management eliminated three board seats and converted to a mostly cash compensation plan for board members. They also promoted longtime board member, Matthew Doheny, to the chairman role.
Entering 2020, the company was in a much better position to benefit if freight volumes turned back up. Things seemed to be off to a pretty good start, as industry executives noted a more stable freight environment in their full year 2019 earnings reports and conference calls.
Then, an awful once-in-a-century pandemic developed seemingly out of nowhere. Global supply chains were disrupted, financial markets went into full-on panic mode, and YRCW’s CapEx reinvestment plans were put on indefinite hold. Through no fault of their own, progress on the multi-point strategic turnaround was abruptly stalled.

Source: YRC Worldwide, Inc.
Although no one could have predicted this pandemic was going to happen, YRCW was not in the best financial position to ride out the storm. The company’s corporate credit ratings were not competitive enough for them to tap credit markets at the same rates as competitors despite management’s focus on financial discipline. Over the last decade, YRC’s management has not wasted a penny on share buybacks nor funded a single dividend payment with debt.
To make matters worse, efforts to deleverage inadvertently led them to miss the only borrowing window they had available prior to the pandemic. In hindsight, industry sell-side analysts picked the perfect moment to turn bearish on the company, or perhaps the publicity attached to their sell-side research turned those bearish predictions into a self-fulfilling prophecy.
Nevertheless, with 30,000 jobs at the crossroads with creative destruction, YRC’s executive leadership did what anyone else in their position would do. They applied for financial relief under the CARES Act.
To their stroke of luck, the company’s role as the leading freight hauler for the U.S. Department of Defense, the CEO’s inclusion in one of the Trump Administration’s Great American Economic Revival Industry Groups, and pleading from Kansas Senator Jerry Moran, the U.S. Treasury Department ultimately saw the company as a perfect vehicle to inject 0 million directly back into the nation’s economy while protecting the livelihoods of tens of thousands of American workers.
On that note, let's recap the Q2 2020 trucking industry earnings season, and then turn the discussion over to the current macroeconomic and industry environment. A later section will present a series of compelling arguments for why the company's stock price may keep trending higher, as we thoroughly examine the multi-point thesis introduced earlier. Towards the end of this article, readers will learn how the price target was determined.
Trucking Industry Earnings Season Recap
The shelter in home period linked to the COVID-19 pandemic took a sizeable bite out of freight shipment volumes in the second quarter of the year. But by the end of May, volumes had quickly stabilized and now appear to be recovering swiftly from the pandemic. Earnings reports from Heartland Express (HTLD), J.B. Hunt (JBHT), and U.S. Xpress (USX) which are industry peers on the truckload and brokerage side, indicated that the extent of economic damage from the pandemic has been minimal. In July, shares of UPS (UPS) rallied strongly following a surprise earnings beat from FedEx (FDX) which benefited from stronger than normal ecommerce activity.
On the LTL side of the industry, earnings results fared better than expected. Industry peers Old Dominion (ODFL), Saia, Inc. (SAIA), and ArcBest Corp. (ARCB), reported smaller year-on-year profits as well as revenue declines, while XPO Logistics (XPO) veered towards a net loss.
YRC Worldwide’s quarterly loss widened over the same period last year. Performance was impacted by a sharper revenue decline than industry peers, as speculation of the company’s survival led to the loss of some customer accounts. However, a combination of layoffs, furloughs, deferred health and welfare expenses, and accrued interest led to a smaller than projected quarterly loss of -.09 versus the average Wall Street estimate of -.66. These cost reductions helped lift the company’s liquidity position to 3 million compared to million for the same period last year, and 8 million at the end of Q1 2020.
During the conference call, management addressed many of areas covered in our long thesis and shared their perspective about the Congressional Oversight Committee’s inquiry. They also announced that they had already drawn on 5 million of the 0 million made available through ‘Tranche A’ of the CARES Act loan to pay off all the deferred and accrued expenses. Lastly, management elaborated further on their spending plans for the 0 million from ‘Tranche B’ of the CARES Act loan, which is earmarked for new fleet equipment.
The company plans to replace their oldest fleet equipment first with either ‘lightly used’ equipment or completely new equipment ordered to spec. However, the availability of collision-avoidance features, powertrain warranty, and tax credit opportunities on new equipment suggests OEM orders will be the way to go. In a later section, we will discuss the potential cost savings from new equipment, as we explore each point of the long thesis. In the meantime, the current freight environment needs to be addressed.
The Current Transportation Environment
Though shipment volumes have demonstrated weekly improvement since the lockdown period was lifted, recent tonnage and shipping activity remains below 2019 levels. The chart below depicts the monthly U.S. DOT - Freight Services Index published by the Bureau of Transportation Statistics unit of the U.S. Department of Transportation. These data are be used by investors, economists, and analysts to gauge the health of the trucking industry. The index shows that freight services bounced up in May after bottoming out in April, adequately reflecting the economic reopening. Despite all the economic optimism, transportation activity for May was near levels unobserved since 2017. Though the rebound has continued to pick up momentum since June, activity levels remain near 2017 levels.
U.S. DOT - Freight Services Index

A second chart presented below, measures trucking tonnage at the national level. The Truck Tonnage Index is another monthly data series published by the Bureau of Transportation Statistics. This index is based on calculations from the American Trucking Association's advanced Truck Tonnage Index.
Once again, the index shows the same trend as the Freight Services Index pictured above. Truck tonnage collapsed to 2017 levels in April but started to rebound sharply in May. The small rebound indicates the recovery has not been as robust as transportation company market valuations reflect.
The “ Dow theory” or “ cyclical play theory” may partially explain this detachment of prime transportation company valuations from the fundamental reality. If that is the case, it means investors have positioned themselves to benefit from an upturn in the economic cycle, as trucking firms are typically regarded as the first in line to benefit from an improving economy.
U.S. DOT - Truck Tonnage Index

Source: U.S. DOT, Centaur Investments
Because of the lag in government data, a better measure for tracking freight industry activity is the Cass Freight Index published on a monthly basis by Cass Information Systems. Stifel Nicolaus Transportation Research Director, David Ross, publishes a useful blog post to accompany the data releases. As the illustration below shows, freight shipments continued to rise at a slightly faster pace in June but remain far below 2017 levels despite the lifting of most nationwide lockdown orders, reopening of manufacturing businesses, and resumption of air freight and maritime import activity.
Cass Information Systems - Freight Shipments Index

As the pandemic rattled the market and disrupted global supply chains, Wall Street analysts slashed revenue and earnings estimates across the industry. The lowered hurdles allowed most trucking firms to easily beat analyst targets, powering investor confidence in the sector. Contrary to all the data presented above, stock prices across air freight and logistics have returned 30% over the last year and 31.4% year-to-date. Meanwhile, the S&P 500 has returned 15.8% on a 52-week basis, and just 4.6% on a year-to-date basis, according to Fidelity Investments.
While most trucking firms have reinstated quarterly and full year guidance, management teams remain cautious in their outlooks for the rest of the year. Despite the grim reality, it remains unclear exactly what is sustaining trucking company valuations. Some investors may be betting on essential transportation businesses and ecommerce due to the mass media’s portrayal of panic and impulse buying at big box, grocery, and online retailers, but that behavior is simply not reflected in the data or financial performance. The truth is unemployment remains very high, the pandemic has been relentless, and the economic recovery is simply not as robust as the stock market implies.
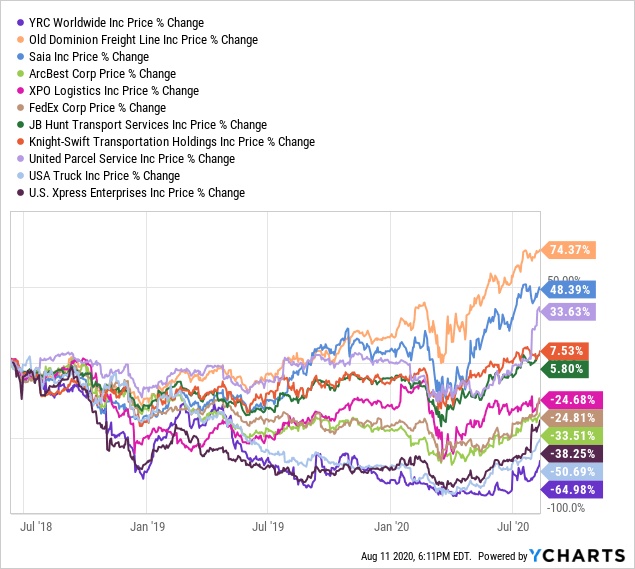
A quick review of the YRCW’s stock price performance relative to the industry as illustrated below demonstrates a clear and perhaps much exaggerated divergence in performance from the rest of the industry, despite the sizeable capital injection from the U.S. Treasury. This gap is not just a stock price performance gap either, it is a glaring valuation gap affecting all trucking companies perceived as fragile, even though fundamental performance has been similar across the industry. The valuation section presented near the end of this article will further analyze this apparent gap, which may help predict where YRCW's stock price is headed. For now, please have a look the 3-year stock price performance chart below.
Trucking Industry 3-Year Stock Price Performance Gap
 Data by
YRCW's share performance is the purple line at the very bottom of this chart. Despite the obvious open runway for operational improvement and massive liquidity position which were highlighted on multiple occasions during the most recent conference call, the stock price has barely moved to close the performance gap.
Whether or not this divergence is sustainable, it may suggest there is still much investor confusion regarding the company’s current situation. Can one blame investors for their confusion? YRCW is a highly complex case study with multiple moving pieces that must be considered collectively. Forming an investment opinion from social media commentary, attention-seeking articles found through Google searches, or statistics available on financial media platforms like Yahoo Finance is simply not a practical approach.
Even looking at the company’s financial statements in isolation is insufficient. Understanding YRCW requires a complete dissection of every financial report from the last decade down to its last detail hidden in the footnotes. It also requires reading or playing back dozens of earnings calls and transcripts, and combing through years of presentation slides, mid-quarter updates, and 8-K SEC filings while considering economic and demographic changes over years.
Most importantly, one must set aside personal biases, predetermined judgments, misconceptions described by people on social media and in person, and recognize that past performance is not an indicator of similar future results.
In today’s fast-moving markets where speculators make split-second decisions based on patterns in a stock price chart or chatter in a private trading chatroom, few take the time to delve deep into a single company to verify if their considered opinion about a company checks out.
The latter of the three is the precisely what Centaur Investments sets out to do in all of our research. An objective since initiating coverage on YRCW is to offer a variant perception; one that pokes holes into every logically inconsistent bias and bearish assumption commonly shared by the public. In addition to this variant perception, a second objective is to help investors piece together as much of a complete picture as possible about this company from all the noisy information scattered across the internet.
The Bullish Thesis Breakdown
This latest iteration of the long thesis is based on an extensive review of the company’s history, management, property and equipment assets, fleet age and size, service center coverage area, operational and idiosyncratic challenges, cultural challenges, and financial performance over the last 10 years. This is quite possibly the most thorough evaluation of the business on Seeking Alpha, period.
The analysis efforts extended to multiple iterations of financial models which tested different paths the company could take to improve financial performance 5 to 10 years into the future. The conclusions drawn from the analysis suggests there is a considerable value to be extracted from the business' network, workforce, and property and equipment assets. If investors and analysts would simply give the company the benefit of the doubt, when allowed to work freely, YRC’s management could potentially generate sizable and consistent free cash flow gains over the next decade.
In our view, value has been suppressed by a combination of excess capacity, leverage, high cost of debt entering the financial crisis, and externalities such as the massive output collapse in industrial activity across the U.S. in the aftermath of the Great Recession. Additionally, YRCW’s recovery was also inhibited by an effort to run the company out of business as industry competitors engaged in a series of aggressive short-term price-cutting tactics.
The combination of these factors contributed to persistently poor credit ratings from agencies despite effective decision-making and relentless efforts by former CEO James Welch and current executive leadership to engage in the most efficient capital allocation in perhaps LTL history. These factors fueled a feedback loop of persistently high cost of debt and inability to raise additional capital in equity markets.
Furthermore, the company’s decade-long share price volatility has been more recently exacerbated by popular bearish views towards the company. These bearish views are influenced by multiple cognitive biases due to the complexity of the business’s challenges, as investors consistently compared the company and its unique situation to financially healthier and physically smaller industry competitors which more easily outperformed in the post-recession economic environment.
While the bearish opinions may have been appropriate during the 2008 recession, they remain intact despite a well-defined business strategy, and substantial runway for operational improvement compared to richly valued prime LTL competitors.
Of all the paths to profit improvement tested in our models, the two most rational scenarios arise from achieving full fleet replenishment and maximizing density or load factor within the company’s network. YRCW’s potential for value creation may be further compounded by improved worker productivity, improved business visibility from modern transportation management software, reduced interest expenses in the future, and a decline in cost of capital.
While richly valued industry peers are already near peak operational efficiency levels, efforts to improve on that level of efficiency will only yield marginal operating ratio improvement. YRCW, on the other hand, can potentially experience large operating income gains from essentially any incremental improvement in their operating ratio.
As stated in the introduction, this thesis is largely based on management’s multi-pronged turnaround strategy which we find to be highly realistic. In 2019, after the ratification of a new National Master Freight Agreement (NMFA) with the Teamsters’ Union, management shared their refined strategy for achieving sustainable profitability over a 5-year period during a presentation given at Deutsche Bank’s annual ‘ Global Industrials and Materials Summit.’ The precise reasoning behind each catalyst of the long thesis introduced earlier will be outlined for the reader over the next several paragraphs. After discussing these upside catalysts, we will reveal the supporting financial models behind our own valuation estimate of the business.
ONE: Industrywide pricing and capacity discipline will support multi-point strategy while allowing the company to offset cost inflation through periodic contractual and general price increases.
In the price wars that followed the Great Recession, carriers learned that attempting to undercut one another was a losing formula. Like the old saying goes “an eye for an eye will make the whole world blind,” LTL carriers today are observant of the fact that attempting to undercut one another through aggressive price cutting tactics will only end up hurting everyone.
Currently, the industry has entered a phase where competition is more about service quality and operational efficiency than offering low shipping prices. This is because transportation costs trend up over time, not down. To combat cost inflation, carriers push for periodic general rate increases and strive to lock in higher contract prices each year. Carriers are also constantly looking for ways to cut down costs, increase efficiency, and protect margins.
For example, most carriers today have freight dimensioners installed at strategic points across their networks to help catch uneconomic freight. Additionally, transportation software and real-time market data has dramatically improved market efficiency to the point that carriers can turn capacity on and off much better than they have in the past. This discipline protects market pricing and profit margins for the entire industry, while indirectly supporting YRCW’s turnaround strategy.
TWO: Property in suburban metro areas acquired over a century and recorded at cost on the balance sheet is a goldmine of hidden asset value which the market does not seem to realize.
On this belief that YRCW’s balance sheet understates the intrinsic value of its business assets, Centaur Investments is not alone. This view was emphasized in this investor letter, and this video published last year by the investment team of notable YRCW shareholder, Front Street Capital Management. The striking similarities between Centaur's long thesis and Front Street's are entirely coincidental. Centaur Investments was not aware of their investment or thesis until they published the video in June of 2019.
With regard to YRC's property, while this observation is not exactly an actionable investment catalyst, it does offer an excellent perspective on how undervalued this business is. What is striking here is that when most investors look at the company’s balance sheet, this is what they see:

Sources: YRCW’s 10-K SEC filings, Centaur Investments
That is, they only see the small PP&E value of just 0 million in 2019 and the shrinking total asset figure over time. However, there is a lot more information outside of these financial statements that is easily ignored if one only looks at the balance sheet. Part of that decline can be explained by the retiring or selling of property or depleted equipment, but the dominant part is a quite obviously the steady non-cash outflow of accounting math known as accumulated depreciation.
Property values are recorded at cost on the balance sheet and depreciate over time, and this means balance sheets ignore any sort of fair market value appreciation over decades. Consider this: how is the business able to support .5 to billion in sales from just 0 million in property and equipment? This is the part of the answer:

Source: YRC Worldwide's Deutsche Bank Presentation Slide Deck
YRC Worldwide is a nearly 100-year-old business. Since inception, the company has accumulated a substantial number of real estate properties to build out its hub and spoke network. In that timeline, the company has watched full blown suburban areas grow around many of its service facilities. While they have sold off many properties since the 2008 financial crisis, they still have a larger international coverage than each one of their LTL pure-play competitors.
As of December 31, 2019, the company had a total service facility count of 351 properties. They owned 182 service facilities outright, or about 52% of the total count. Some of the company’s service facilities are in impossible to duplicate industrially-zoned areas right in the middle of residential neighborhoods in some of the most highly populated urban metro areas of North America. These properties were recorded at cost on the balance sheet and were subject to accounting depreciation over decades. It's usually large institutional investors or hedge funds in particular who tend to notice these glaring property value to market capitalization mismatches.

Source: YRCW's FY 2019 10-K SEC Filing
But small-cap names do not typically attract much institutional investor attention. To complicate the matter, YRCW's low price per share, daily trading volume, and total share count fits the perfect profile for day traders. These speculation-driven traders are often more interested in short term events, and naturally tend to overlook the intrinsic value of a company's balance sheet assets. Of the few institutional groups that have taken note of YRCW's property, one of them is Apollo Global, the company’s main creditor. This may partly explain why executives at Apollo quickly cooperated with YRC's management to modify the 0 million term loan covenant during this year's pandemic.
To confirm if there was a probability that YRC's PP&E had a higher market value than the depreciated figure found on the balance sheet, Centaur Investments took the map above and manually searched for the properties online. Additionally, an online search for used commercial equipment values was conducted to estimate the fair market value of the company's fleet. County tax websites and commercial real estate websites such as 'loopnet.com' were used for property estimates. Commercial equipment marketplace websites such as 'truckpaper.com' were used for fleet equipment estimates. The table below offers three conservative estimates of the fair market value of the YRCW's property and equipment assets.
 Source: Centaur Investments
Ignoring discount rates, potential cash flows, opportunity costs, and other exogenous factors, the PP&E analysis concluded that YRCW minimum average service facility value could be between and .5 million. The calculations above assume half of YRCW’s fleet equipment assets are worthless. This is either due to equipment age or because some may be under a lease agreement. The other half of the YRCW's fleet are assumed to fetch fair market rates. At fair market, the owned portion of YRCW's fleet may be valued somewhere between 5 million and 8 million. Mixing and matching the different estimates yields a range of valuations starting with the depreciated balance sheet value of 0 million and upward to .1 billion. Take a moment consider this range of estimates, relative to the current 0 market capitalization of the business.
Assuming the 0 million CARES Act loan is eventually converted into business assets, the range increases to .5 billion to .8 billion. However, based on the sizeable profits YRCW has recently booked on small real estate sales, such as the one disclosed on page 78 of their FY 2019 10-K SEC filing, it is entirely possible that the average service facility value may be considerably higher than the calculations shared above. Based these calculations, the market value of the business's property and equipment alone may be between and per share, depending on the assumed diluted share count.

Source: YRCW's FY 2019 10-K SEC Filing
It is important to make clear that this section is not meant to imply that the company will or should unload property to collect cash. Rather, it is meant to demonstrate how undervalued the company's shares are, and to provide a better basis on which to assess the company's total debt balance.
THREE: YRCW's 3PL startup venture, HNRY Logistics, provides the company with a new sales vertical and contribution margin through new asset-light services, offering longer term sales growth potential.
Another source of hidden asset value comes from YRCW’s HNRY Logistics brokerage venture which the market is still not pricing in at all. The unit actually helped the business offset revenue declines on the LTL side during both FY 2019 and the pandemic. As a multimodal and multiservice unit, HNRY can be thought of as essentially a third-party logistics (3PL) business.
Through HNRY, YRCW is able to capitalize on existing customers that need services which the company’s asset-heavy side is not equipped to offer. These services are outsourced by the company to trusted partners and independent contract carriers.
Wherever possible, HNRY generates additional LTL sales by marketing the entire asset-heavy side of the business to existing and new customers, and contributes margin by securing back-hauls for the long-haul side of the business. This recent announcement of a new dedicated pool distribution contract booked with an unnamed major American retail operation is a perfect example of HNRY's long-term sales growth potential.
Based on the Deutsche Bank presentation slide deck published last year, HNRY was on track to deliver 0 million in sales for FY 2019 and projected to deliver 0 million in FY 2020 prior to the pandemic. Management is currently targeting for the unit to eventually account for 20% of YRCW's total revenue mix.
For those who may not be aware, some costs incurred through HNRY are currently imbedded in the purchased transportation line item on the company’s income statement. Purchased transportation expenses as a percentage of total sales have increased by 200 basis points since HNRY Logistics was formed. A derivative calculation can be applied to YRCW’s total sales to reverse-engineer a sales projection for HNRY. Additionally, note 2 on page 7 of the company's most recent 10-Q SEC filing offers a "revenue disaggregation" which may be also viewed as a decent proxy for HNRY's sales.
 Source: YRCW's Second Quarter 10-Q SEC, via Seeking Alpha
Though HNRY is now in its second fiscal year, 2020 has turned out to be much more challenging than management had in mind. Even so, the unit should be expected to power revenue growth well beyond 2021.
On a final note, new language included in the labor agreement signed last year authorized an increase in YRCW's use of purchased transportation. The higher purchased transportation allowance supports multimodal and third-party services offered through HNRY. As an example, in 2019, the company added over 1,000 YRC Freight-branded containers to support multimodal services.
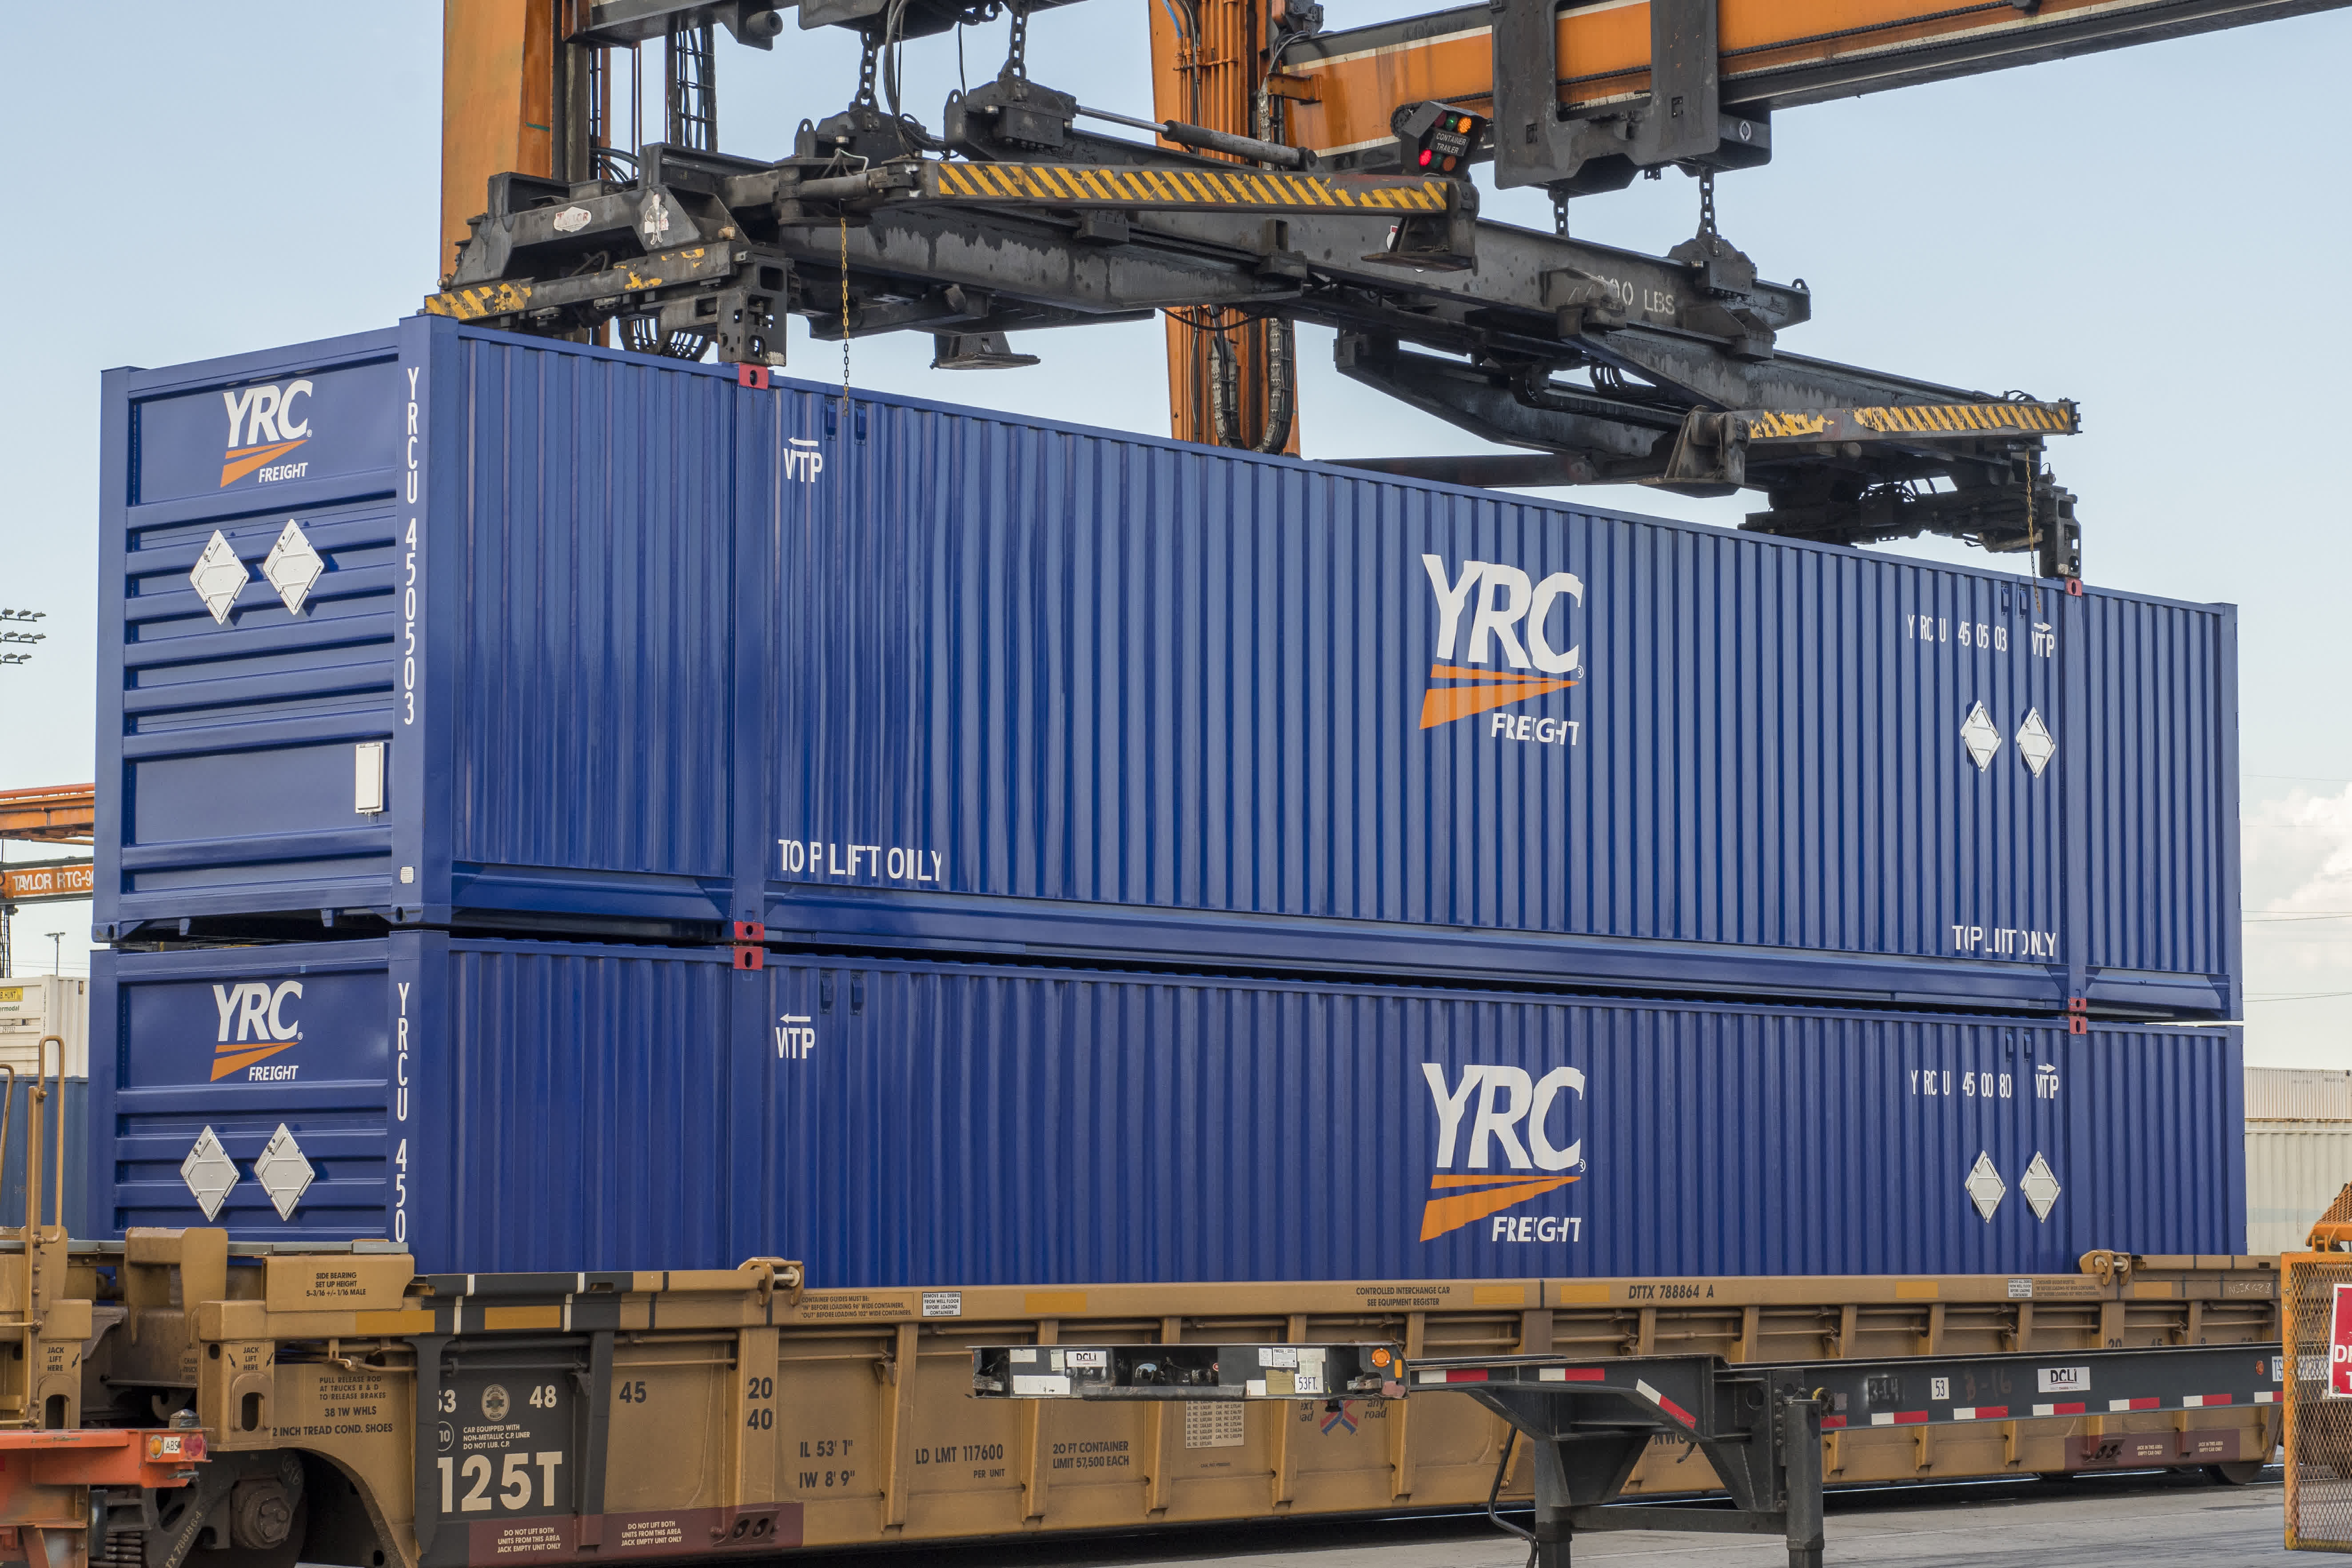
Source: GlobalNewswire
Centaur believes the current equity value of HNRY may currently be somewhere between million and 0 million, as the growth rate of that unit was much higher than YRCW’s asset-heavy business in FY 2019. Once again, take a note of how that figure compares to YRCW’s current market capitalization, which is around 0 million today. If HNRY's growth rate picks up when the economy rebounds, investors can expect to see the company break out financial performance data for HNRY Logistics as a separate business unit. When that happens, such event would lead to a new sum of the parts valuation for the whole business and drive the market to reprice the shares higher.
FOUR: Revenue equipment replenishment will substantially reduce maintenance and fuel expenses, leading to immediate sequential decline in the company’s operating ratio.
The intuition behind thesis point four is that as the company takes delivery of each new piece of equipment, they will experience immediate gains in gross and operating margin on a sequential quarterly basis.
In the past, the company’s pace of deleveraging and fleet replenishment has not kept up with investor and analyst expectations. Even though operations have improved dramatically since 2009, operating cash flows have simply not been robust enough to support high capital spending on a new fleet equipment. Under normal circumstances, the company could have simply issued a low coupon bond to finance a completely new fleet.
But the company’s less-than-stellar corporate credit rating exiting the financial crisis meant they had to hold off on reinvestment until their operations and financial position stabilized. Though the fleet reinvestment program was started in 2013, the company has been limited to what they could afford through a combination of cash flows and high-interest equipment leases.

Source: Pg. 39 of YRCW’s FY 2019 SEC 10-K filing
Despite the limitations, progress has been slow and steady. Based on delivery counts management has shared on conference calls and industry conferences, Centaur Investments estimates that progress to get the fleet down to the industry average age was around 45% to 50% at mid-2020.
Per management’s comments, each new truck cuts operating expenses by 15% over the truck it replaced. These savings come from reduced fuel consumption and maintenance related expenses. Per YRC’s CFO, the average annual maintenance expense for a 1-year old tractor is between ,000 and ,000, compared to ,000 to ,000 for the aged tractor it replaces.
At 50% of a fleet size of 14,000 tractors, that means about 7,000 tractors still need to be replaced. Once the fleet is up to par with the industry, the math translates to a minimum of million in maintenance-related cost savings, or approximately .25 in EPS going right to the bottom line. Keep in mind that that number is only scratching the surface.
While the new tractors being added are safer, fuel efficient, and require less maintenance, the newer rolling stock equipment is better-looking, lighter, stronger, and less costly to repair. Most importantly, every bit in cost savings will help the company add additional capacity to fight back against competitors like Old Dominion who has already added 9 new service facilities this year.
While management is well aware of the potential cost and interest savings, the market seems to want to see the results first. For investors willing to take the risk, the next couple of quarters provide ample time for due diligence, and may be the last window of opportunity to invest in the business while it is still cheap.
FIVE: Revenue equipment replenishment eliminates need for expensive short-term rental equipment, emergency roadside repairs, and towing services which will deliver cumulative operating ratio improvement.
This note on thesis point number five will be brief, as it is relatively straightforward to understand. The notion here is that a side effect of having roughly 7,000 tractors over 5 years old means there is a higher probability of roadside breakdowns, and expensive repair and towing bills. It also means having to tap high-cost rental equipment to support daily operations each time a truck is out of service needing repair. As the company phases in new equipment over the next 4 to 6 quarters, these added costs and associated risks will start to fall off and further contribute to operating ratio improvement. As these risks and costs decline, the market in theory should further reprice the company’s shares higher.
0
0
0
0
0
0


